Phosphorus is a mineral nutrient essential for life. Cells require it to grow and proliferate. Elemental Phosphorus (P) does not occur as such. Being highly reactive, it is usually present as phosphorous (P-bearing) compounds, most common being PHOSPHATE (PO4-3). P is found in many ionic forms. Some of the common ionic forms of phosphate are the oxidized species of phosphoric acid (H3PO4), phosphorous acid (H2PO3), and hypophosphorous acid (H3PO2), along with their salts. Often, in nature, there are 2 elements that may become limiting, controling the growth - Nitrogen and Phosphorus. One or the other impose constraints on growth, deciding just what will grow and what will not. It has been the limited availability of P in the special environment of the Florida Everglades that formed the whole ecology and appearance of the region. As expanding and intensified agriculture and urban development contribute excess of P into the environment, undesirable changes occur. Toxic blue-green algae that can "fix" nitrogen from the air particularly proliferate when P becomes available. As the natural cycle of phosphorus has become disrupted, P has become a primary concern and challenge for the region. Phosphorus is present in water primarily in 2 forms - organic phosphate and orthophosphate. Other species can be present, usually in smaller quantities. Total Phosphorus (TP) is typically the sum of organic and orthophosphate. How do we control it and how do we remediate and remove that phosphorus ? See P-removal techniques on another page.
However, the fact remains - we currently do NOT have cost-effective techniques to control and remove P from the environment to low parts per billion (ppb, micrograms/liter) - on a huge scale as particularly desirable for the Everglades.
Agricultural runoff is a source of P - leading to proliferation of harmful algae in P-rich waters.
EUTROPHICATION
What is eutrophication ?
Within the past 50 years, eutrophication, the over-enrichment of water by nutrients such as nitrogen phosphorus, has emerged as one of the leading causes of water quality impairment. The two most acute symptoms of eutrophication are hypoxia (or oxygen depletion) and harmful algal blooms, which among other things can destroy aquatic life in affected areas.
Within the past 50 years, eutrophication - the over-enrichment of natural waters by nutrients such as phosphorus and nitrogen - has emerged as one of the leading causes of water quality impairment and deterioration. The two most acute symptoms of eutrophication are - hypoxia (oxygen depletion) and - extensive algal blooms which not only destroy aquatic life in affected areas [1] but their toxins pose a direct threat to humans.
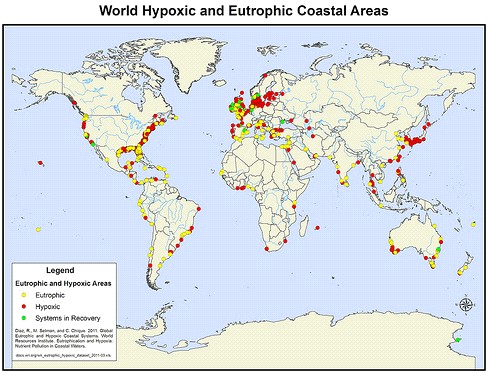
The rise in eutrophic and hypoxic events has been attributed to the rapid increase in intensive agricultural practices, industrial activities, and population growth which, in combination, have increased nutrient flows in the environment [2]. It has been established that human activities have resulted in nearly tripled phosphorus inflows to the environment when compared to natural values [3]. Nutrient over-enrichment of freshwater and coastal ecosystems is a rapidly growing environmental crisis with an immense and wide impact. Worldwide, the number of coastal areas impacted by eutrophication stands at over 500 [4]. In coastal areas, occurrences of dead zones caused by eutrophic conditions have increased from 10 documented cases in 1960 to 405 documented cases in 2008 (Figure 1). One red tide event, which occurred near Hong Kong in 1998, wiped out 90 % of the entire stock of Hong Kong’s fish farms and resulted in an estimated economic loss of $40 million USD [5]. Many of the world’s freshwater lakes, streams, and reservoirs suffer from eutrophication.
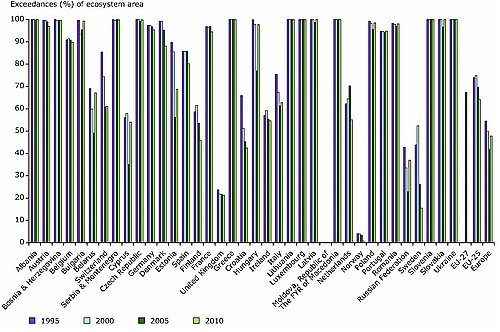
Also in the United States eutrophication is thought to be the primary cause of freshwater impairment. Many of the largest freshwater lakes are eutrophic, including Lake Erie and Lake Okeechobee (United States), Lake Victoria (Tanzania/Uganda/Kenya), and Tai Lake (China) [6]. Figure 2 presents the percentage of eutrophication damaged freshwater ecosystem areas in Europe. The estimated annual cost of freshwater eutrophication in the US alone is as high as US$ 2.2 billion [7].
Figure 1: World hypoxic and Eutrophic coastal areas
Figure 2: Country freshwater ecosystem damage area from eutrophication in Europe from 1995 to 2010. Source: European Environment Agency (www.eea.europa.eu)
IMPACTS of P on Ecosystems
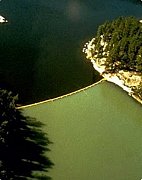
Once nutrients reach natural environments, they can trigger a number of responses within the affected ecosystems. The initial impacts of nutrient increases are the excessive growth of phytoplankton, microalgae (e.g., epiphytes and microphytes), and macroalgae (i.e., seaweed). These, in turn, can lead to other impacts such as: loss of subaquatic vegetation, change in species composition, coral reef damage, low dissolved oxygen, and the formation of dead zones (oxygen-depleted waters) that can lead to the collapse of entire ecosystems. Figure 3 presents the difference between a mesotrophic (moderately enriched) and eutrophic water bodies (source: World Resources Institute). The symptoms of eutrophication in both fresh and salt waters can lead to loss of aesthetic, ecological, and economic value of aquatic ecosystems. Dead zones are an emerging problem in Asia, Africa and South America that can actually be observed in locations around the world [8]. Excess P input from point sources such as sewage treatment plants has been curtailed in freshwaters of the developed world since passage of the Clean Water Act and similar laws. However, non-point source pollution that originates from diffuse sources is still an important water-quality problem [11,12]. In fact, the major source of P in freshwater in the United States is the non-point source flux from land to water [13,14,15].
This divided body of water shows the difference between mesotrophic (moderately enriched, uper basin) and eutrophic water (lower basin)
Figure 3
♦IMPACTS of P on Human Well-Being
Nutrient pollution from agricultural and urban non-point source run-off remains a major global problem - including many health-related implications. Best management practices developed to control the non-point sources are not being widely implemented because of the lack of regulations that stems from the perceived higher costs of the most effective practices. Harmful algal blooms have increased in freshwater and coastal systems over the last 20 years (Figure 4) [8] . As algal toxins become concentrated in the fish and other marine organisms, they can cause fish and shellfish poisoning or paralysis. Cyanobacterial toxins can also cause acute poisoning, skin irritation and gastrointestinal illnesses in humans. The blooms (including red tides) have caused neurological damage and death in people through consumption of affected seafood [9]. Table 1 summarizes the human well being and ecosystem impacts caused by increased nutrient levels.
Changes
Ecosystem impacts
Human well being impacts
Human health
Food security
Socio-economic
↑ Nutrients
↑ Eutrophication
↑ Contamination of drinking water
↑ Production of macrophytes for animal fodder
↑ Cost of water treatment
↑ Harmful
algal bloom
↑ Fish and shellfish contamination ↑ Neurological and gastrointestinal illnesses
↓ Livestock health ↓ Food available for humans
↓ Recreational and tourism ↓ Livelihood income
Table 1: Ecosystem and human well-being impacts caused by increased nutrient levels (Source UNEP-GEO 2009)
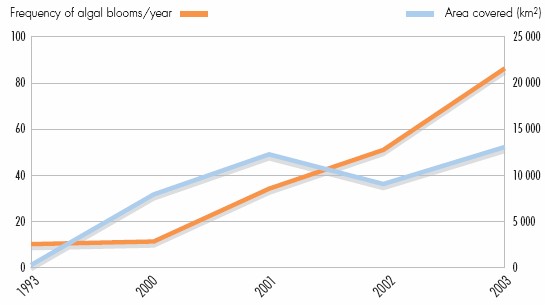
As an example, in the East China Sea, the number of harmful algal blooms increased from 10 in 1993 to 86 in 2003, when they covered an area of 13 000 km2. Fertilizer application in the sea’s catchment area has increased by as much as 250 %, notably in the upstream and coastal provinces of Anhui and Jiangsu, contributing a high nutrient loading to the sea. The blooms, which mostly occur in the inner shelf of the Yangtze River, had a range of human wellbeing and ecosystem implications. High mortality rates of fish and benthic organisms have also been observed.
Figure 4: Algal blooms in the East China Sea.
(Source UNEP-GEO 2009).
The drivers of eutrophication are expected to increase for the foreseeable future.
Specifically:
World population will continue to grow, reaching an estimated 9.2 - 10.6 billion by 2050 (UNESCO estimate in 2011), which will increase pressures on the productive capacity of agriculture and industry. Intensive agriculture and land use conversion—for crops, livestock, and aquaculture—will increase, especially in the developing world. In addition to population growth, intensification is driven by changing dietary patterns. For example, over the period from 2002 to 2030, global meat consumption is expected to increase by 54 %.
In general, fertilizer consumption is expected to increase 40 % between 2002 and 2030 [10]. The majority of the projected increase in global fertilizer consumption is attributed to the developing world where food production and adoption of intensive agricultural practices are expected to increase [10]. As a result of these increasing global trends in population growth, fertilizer consumption and agricultural production, it is expected that coastal and freshwater systems impacted by eutrophication and hypoxia will continue to increase, especially in the developing world [6].
Accelerated eutrophication stems, to a large degree, from agricultural run-off caused by indiscriminate application of inappropriate fertili-
zers that end up in the aqueous environment.
♦ PHOSPHORUS USE & DEMAND
The agricultural "green revolution", successfully feeding population billions, would not have been possible without fertilization of fields ...
Virtually every living cell requires phosphorus. However, the soil from which plants obtain phosphorus typically contains only small amounts of it in a readily available form. If soils are deficient in phosphorus, food production is restricted unless this nutrient is added in the form of fertilizer. Hence, to increase the yield of plants grown for food, an adequate supply of phosphorus is essential. Farming practices that are helping to feed billions of people include the application of phosphorus fertilizers manufactured from phosphate rock, a non-renewable resource used increasingly since the end of the 19th century.
Excessive P inputs: It is still not a common practice to account for input and output of chemicals in the environment (mass balancing, budgeting). The P budget of the upper Potomac River Basin revealed that over 60% of imported P was retained within the watershed [16]. In this case, P retention was caused by an excess of fertilizer and animal feed inputs over outputs of agricultural products.
In a Florida study, Fluck and colleagues (1992) [17] found that less than 20% of P input to the Lake Okeechobee watershed in fertilizers was output in agricultural and other products. Some national and international studies reveal similar human impacts and increased P storage in terrestrial ecosystems. In every case, P accumulation was caused not by a natural imbalance in P inputs and outputs but by inputs of fertilizer and animal feeds that exceeded outputs in agricultural products [18,19].
P is flushing into the oceans: Based on the modern fluvial P flux, the amount of P discharged from the worlds rivers to the ocean, is estimated to be 22 Tg.yr-1 (1 teragram = 1 million metric tons) [20]. The agricultural P budget indicated that the average annual P accumulation in agricultural areas of the world was 8 Tg.yr-1 from 1958 to 1998. Increasing soil P levels elevate the potential P runoff to aquatic ecosystems [13].
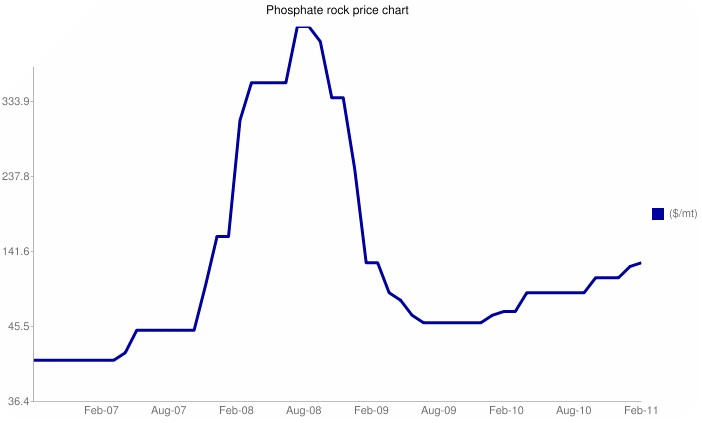
P in brief: About 4 % of mined P (1 Tg.yr-1) is used to manufacture products such as flame retardants, paper, glass, plastics, rubber, pharmaceuticals, petroleum products, pesticides, and toothpaste, which are not added to surface soils. Equivalent amount of mined P is also used to make calcium phosphate nutritional supplements for animals. Current phosphate rock price is around $ 140 per metric ton (Figure 6). This means that annually, the amount of P discharged from the worlds rivers to the ocean is estimated at about $ 3 billion.yr-1. The amount of P accumulated in agricultural areas of the world is estimated at about $ 1.2 billion.yr-1. The Commonwealth Scientific and Industrial Research Organization (CSIRO) in Australia has estimated that soils in that country alone contain 10 billion dollars of locked up phosphate that has been lost in this manner [21]. The eradication of hunger and poverty is Goal 1 of the Millennium Declaration, adopted by the United Nations General Assembly in 2000. A 2010 review of progress towards achieving the Millennium Development Goals reported that hunger and malnutrition increased between 2007 and 2009, partially reversing earlier progress [25]. Many of the world’s estimated 925 million undernourished people are small-scale farmers. Phosphorus-based fertilizers are often unobtainable by these farmers, whose productivity could be improved with better access to this input [26].
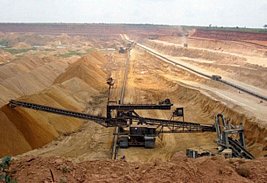
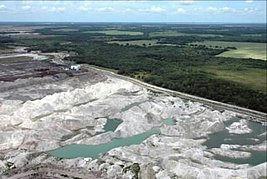
Phosphate mining in Morocco
and in Florida (Mosaic, Inc.)
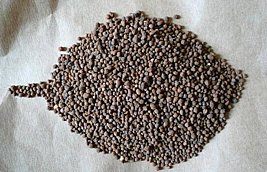
Superphosphate fertilizer product :
♦ PHOSPHORUS SUPPLY
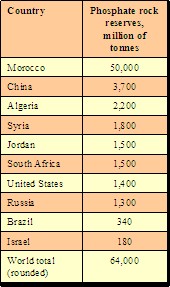
While there are commercially exploitable amounts of phosphate rock in several countries, those with no domestic reserves could be particularly vulnerable in the case of global shortfalls (Table 2).
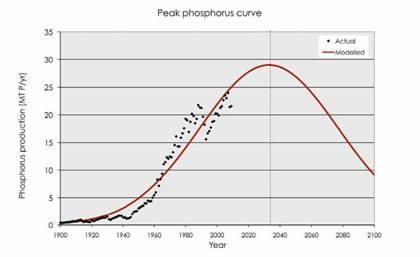
Figure 5: Peak phosphorus curve based on industry data, indicating
a peak year of global phosphate rock population in 2033 [22].
The annual production of phosphate rock in 2005-2010 is around 24 Tg.yr-1. More than 90 - 95 % of rock phosphate is used for fertilizers.
The known supply of cheap, high-grade reserves of phosphate rock is becoming increasingly limited while demand continues to increase. The remaining amount of commercially viable phosphate rock, particularly the lifetime of reserves, has been the subject of vigorous debate among experts during the last few years. For example, Cordell et al. (2009) [22] estimated that peak production of current reserves (that is, phosphate rock known to be economically available for mining and processing) would occur between 2030 and 2040 (Figure 5). The most recent USGS reserves estimates have been revised upward [23], from 16 to around 60 billion tons of phosphate rocks.
Proponents of the peak phosphorus theory argue that even if the timeline may vary, the fundamental issue, that the supply of cheap and easily accessible phosphorus is ultimately limited, will not change.
New phosphate rock mines have been commissioned in several countries, including Australia, Peru and Saudi Arabia, while undiscovered deposits are being widely sought, including in seafloor sediments off the coast of Namibia [24].
Although estimates of the extent of known reserves are increasing, the quality of these reserves requires further evaluation. If the phosphate concentration in the rock declines and larger volumes of ore are needed in order to obtain a given amount of phosphorus, production costs will likely increase. Such changes could also lead to greater energy requirements and more waste in phosphate rock mining. In an open market these factors might well raise the price of phosphorus fertilizers, limiting their accessibility to many farmers and having negative effects on yields. If these were to occur, food security could be threatened in countries that are highly dependent on phosphorus imports.
TABLE 2:
Recent estimates of the world distribution of phosphate rock reserves (USGS 2011)
Figure 6: Phosphate rock commodity price (Morocco) increased 800% between January 07 and September 08. Data compiled by mongabay.com using figures from World Bank Commodity Price Data. Data is available from http://www.mongabay.com/images/commodities/
charts/chart-phosphate.html
WATER QUALITY
Increasing water scarcity is undermining development, food security, public health and ecosystem services. By 2025, about 1.8 billion people will be living in countries or regions with absolute water scarcity, and two-thirds of the world population could be under conditions of water stress – the threshold for meeting the water requirements for agriculture, industry, domestic purposes, energy and the environment [27]. Rapid industrialization and increasing agricultural use have contributed to worldwide water shortages. Areas that have experienced water shortages include China, Egypt, India, Israel, Pakistan, Mexico, parts of Africa and the United States (Colorado, California, Las Vegas and the East Coast), to name but a few. Water scarcity and stress will have major impacts on farming activities. While irrigated agriculture is overwhelmingly the biggest user of freshwater, and already draws substantially on groundwater that is not being replenished, it faces increasing competition from other claims. To meet the United Nation Millennium Development Goal (MDG) of halving the proportion of people suffering from hunger by 2015, it will be necessary to manage freshwater resources from the moment that rainwater hits the land surface. Continued deterioration in the quality of limited surface water, as a result of industrial, domestic and agricultural effluents, aggravate water scarcity, and affect human health and ecological systems [8]. Significant capital and operating costs are associated with treating water. The presence of agricultural pollutants in sources used for drinking water or environmental water can require the removal of nutrients. In some cases, polluted drinking water supplies are blended with cleaner water sources or, where the level of treatment required is so great as to be uneconomic, the supply is decommissioned, requiring a new source to be found. In other cases, polluted freshwater are discharged into estuaries to avoid ecosystem degradation (as it frequently happens in Florida).
Well documented (fresh) water scarcity around the globe goes hand in hand with deterioration of water quality that is, in many cases, caused by fertilizer run-off from the fields. Ineffective and harmful overfertilization of fields as well as the use of inapropriate cheap fertilizers is the culprit.
References
Apart from oil, there's another critical resource out there whose coming peak has gotten much less attention. But unlike oil, it has no alternative. We truly can't live without phosphorus. The vast majority of the world's supply is locked up in just one country, Morocco. So how do we fight the coming phosphorus shortage ? Click HERE:
[1] World Resources Institute, About Eutrophication, available from http://www.wri.org/project/eutrophication/about, 2010. [2] E.M. Bennett, S.R. Carpenter, N.F. Caraco, Phosphorus and eutrophication: A global perspective, Bioscience, 51 (2001) 227-234. [3] R. Howarth, K. Ramakrrshna, Nutrient Management, in: K. Chopra, R. Leemans, P. Kumar, H. Simons (Eds.) Ecosystems and Human Wellbeing: Policy Responses. Volume 3 of the Millennium Ecosystem Assessment (MA), Island Press, Washington, DC, 2005. [4] M. Selman, S. Greenhalgh, R. Diaz, Z. Sugg, Eutrophication and hypoxia in coastal areas: A global assessment of the state of knowledge, Washington, DC, 2008. [5] S. Lu, I.J. Hodgkiss, Harmful algal bloom causative collected from Hong Kong waters, Hydrobiologia, 512 (2004) 231-238. [6] M. Selman, S. Greenhalgh, Eutrophication: Sources and drivers of nutrient pollution, Washington, DC, 2009. [7] W.K. Dodds, W.W. Bouska, J.L. Eitzmann, T.J. Pilger, K.L. Pitts, A.J. Riley, D.J. Thornbrugh, Eutrophication of US freshwaters: Analysis of potential economic damages., Environ. Sci. Technol. 43 (2009) 12-19. [8] United Nations Environmental Program, UNEP, Global Environment Outlook (GEO-4), Washington, DC, 2009. [9] United Nations Environmental Program, UNEP, Marine and coastal ecosystems and human well-being: A synthesis report based on the findings of the Millennium Ecosystem Assessment, Nairobi, 2006. [10] Food and Agriculture Organization, FAO of the United Nations, Fertilizer requirements in 2015 and 2030, Rome, 2000. [11] National Research Council, Restoration of aquatic ecosystems: Science, technology, and public policy, National Academy Press, Washington (DC), 1992. [12] A.M. Duda, Addressing non-point sources of water pollution must become an international priority, Water Sci. Technol., 28 (1993) 1-11. [13] National Research Council, Soil and water quality: An agenda for agriculture, National Academy Press, Washington (DC), 1993. [14] A.N. Sharpley, S.C. Chapra, R. Wedepohl, J.T. Sims, T.C. Daniel, K.R. Reddy, Managing agricultural phosphorus for protection of surface waters: Issues and options, J. Environ. Qual., 23 (1994) 437–451. [15] T.C. Daniel, A.N. Sharpley, D.R. Edwards, R. Wedepohl, J.L. Lemunyon, Minimizing surface water eutrophication from agriculture by phosphorus management, J. Soil Water Conserv., 49 (1994) 30–38. [16] N.A. Jaworski, P.M. Groffman, A.A. Keller, J.C. Prager, A watershed nitrogen and phosphorus balance: The upper Potomac River basin, Estuaries, 15 (1992) 83–95. [17] R.C. Fluck, C. Fonyo, E. Flaig, Land-use-based phosphorus balances for Lake Okeechobee, Florida, drainage basins, Appl. Eng. Agric., 8 (1992) 813–820. [18] A. Runge-Metzger, Closing the cycle: Obstacles to efficient P management for improved global security, in: H. Tiessen (Ed.) Phosphorus in the Global Environment: Transfers, Cycles, and Management, John Wiley and Sons, New York, 1995, pp. 27–42. [19] H. Tunney, A note on a balance sheet approach to estimating the phosphorus fertilizer needs of agriculture, Irish J. Agric. Res., 29 (1990) 149–154. [20] R.W. Howarth, H.S. Jensen, R. Marino, H. Postma, Transport to and processing of P in near-shore and oceanic waters, in: H. Tiessen (Ed.) Phosphorus in the Global Environment: Transfers, Cycles, and Management, John Wiley and Sons, New York, 1995, pp. 323–345. [21] The Commonwealth Scientific and Industrial Research Organization (CSIRO), Raiding The $10 Billion Phosphorus Bank, in: CSIRO Media release, 1998. [22] D. Cordell, J.O. Drangert, S. White, The story of phosphorus: Global food security and food for thought, Global Environ. Change, 19 (2009) 292-305 [23] S.M. Jasinski, Phosphate Rock. In: Mineral Commodity Summaries 2011, United States Geological Survey, United States Government Printing Office, Washington, DC, 2011. [24] A. Drummond, Minemakers: Targeting Phosphate Production from Two Continents, in: Phosphates 2010 International Conference, Brussels, 2010. [25] United Nations General Assembly, Keeping the promise: United to achieve the MDGs. A forward looking review to promote an agreed action agenda to achieve the Millennium Development Goals by 2015, 2010. [26] R.J. Buresh, P.C. Smithson, D.T. Heliums, Building Soil Phosphorus Capital in Africa, in: R.J. Buresh, P.A. Sanchez, F. Calhoun (Eds.) Replenishing Soil Fertility in Africa. Special Publication No. 51. Soil Science Society of America (SSSA) and American Society of Agronomy (ASA), Madison, Wisconsin, USA, 1997. [27] United Nations, Coping with water scarcity: challenge of the twenty-first century, 2007.